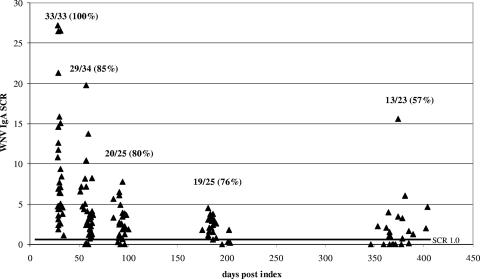
FIG. 2.
Persistence of WNV IgA in blood donors who made a viremic donation. Within a cluster of points around the targeted days postindex (30, 60, 90, 180, and 365 days), each point represents the result for one donor. The values at the top of each cluster are the number of specimens that were positive for WNV IgA/the total number of specimens in the cluster, with the resulting percent positive in parentheses. The dark horizontal line indicates the SCR used to discriminate IgA-positive from IgA-negative results.

