
FIGURE 1. Single-molecule force spectroscopy on ROS disc membranes.
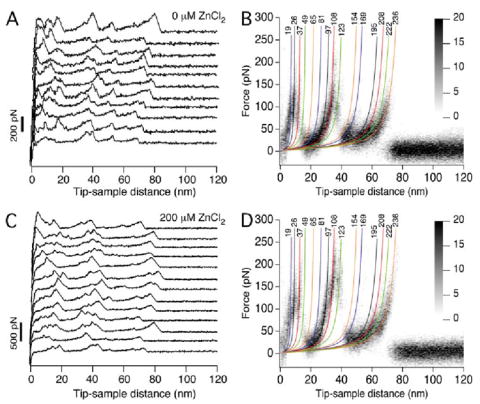
F-D curves were recorded from disc membranes in SMFS assay buffer (A and B) or in SMFS assay buffer supplemented with 200 μm ZnCl2 (C and D). Curves obtained from samples in SMFS assay buffer devoid of ZnCl2 were those reported previously (9). Only curves that exhibited lengths corresponding to the unfolding of a rhodopsin polypeptide chain with an intact Cys110–Cys187 bond (≈65 nm) were analyzed (A and C), and a selection of F-D curves is shown for each condition tested (B and D). Several F-D curves were superimposed (B, n = 42; D, n = 34) to highlight peaks that occurred with high frequency (black) and those that occurred with lower frequency (gray shaded). Each peak in the individual F-D curves was fit with the WLC model to reveal the number of amino acid residues stretched between the probe and the membrane surface. Average values are shown above each fit, and the color of each fit corresponds to the coloring of stable structural segments in Fig. 2.