
FIGURE 4. Effect of different ZnCl2 concentrations on unfolding forces.
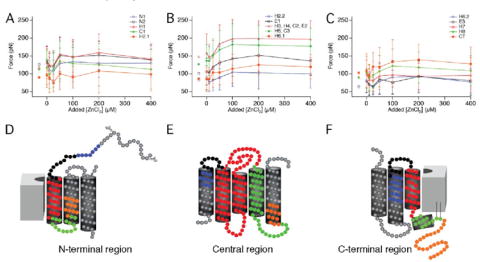
The average force required to unfold each stable structural segment was recorded at increasing concentrations of ZnCl2 (0–400 μm) added to SMFS assay buffer (A–C). The color of the curves corresponds to the structural segments highlighted in D–F. Symbols placed at added [ZnCl2] of less than 0 μm represent data from F-D curves collected in SFMS assay buffer devoid of MgCl2 and in the presence of 1 mm EDTA. Error bars represent the standard deviation. Values represented in the figure are given in Table 1.