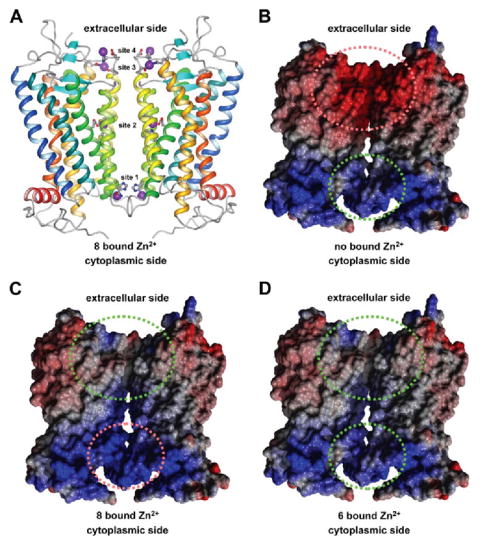
FIGURE 6. Side view of a rhodopsin dimer model.

A, the position of Zn2+ in binding sites observed in crystal structures of rhodopsin are highlighted as purple spheres. Helices of rhodopsin are colored as follows: H-I in blue, H-II in blue-green, H-III in green, H-IV in green-yellow, H-V in yellow, H-VI in orange, H-VII and H-8 in red Amino acid residues that coordinate Zn2+ are shown in ball-and-stick representations. The figure was drawn using MolMol (57). B–D, the electrostatic potential is shown for a rhodopsin dimer without bound Zn2+ (B), with 8 bound Zn2+ (sites 1–4) (C), and with 6 bound Zn2+ (sites 2–4) (D). The electrostatic potential is colored follows: blue, positive; red, negative; white, neutral. Green and red dashed ellipses indicate favorable and unfa vorable electrostatic interactions, respectively. B–D were drawn using Yasara (version 6.2 Yasara Biosciences, Graz, Austria).
