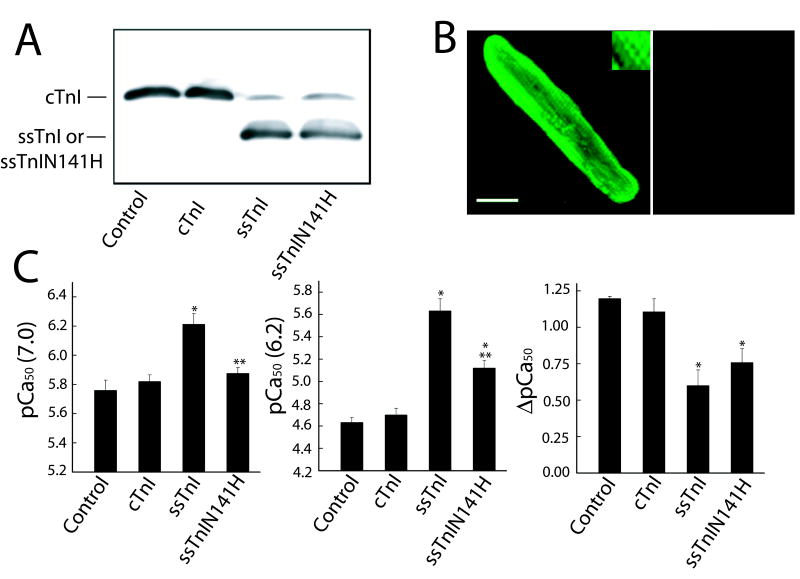
FIGURE 7.
Expression of ssTnIN141H 6 days after gene transfer (A, B) and influence on myofilament Ca2+ sensitivity of force at pH 7.0 and 6.2, 5–6 days after gene transfer (C). A. Representative expression of ssTnIN141H, and comparison to non-infected control myocytes and myocytes treated with adenoviral vectors for cTnI and ssTnI 5–6 days after gene transfer. Similar results were obtained in intact and permeabilized myocytes 6 days after gene transfer (results not shown). B. Immunhistochemical staining of troponin I showing a striated pattern of TnI expression (left panel), and loss of cTnI expression as ssTnIN141H replaces endogenous TnI (right panel). C. The pCa50 at pH 7.0 (left panel), 6.2 (middle panel), and the shift in pCa50 between pH 7.0 and 6.2 (right panel) for myofilament tension generation in myocytes expressing ssTnIN141H (n = 5) compared to cTnI- (control n = 8; cTnI n = 5) and ssTnI (n = 8) -expressing myocytes. Values are expressed as mean ± SEM and results were compared by a 1-way ANOVA and Tukey’s multiple comparison test, with *p<0.05 versus control and **p<0.05 for substitution mutant versus ssTnI. The pCa50 in myocytes expressing ssTnIN141H is very similar to cTnI at pH 7.0, but the response to acidic pH more closely resembles the response observed in ssTnI-expressing myocytes.

