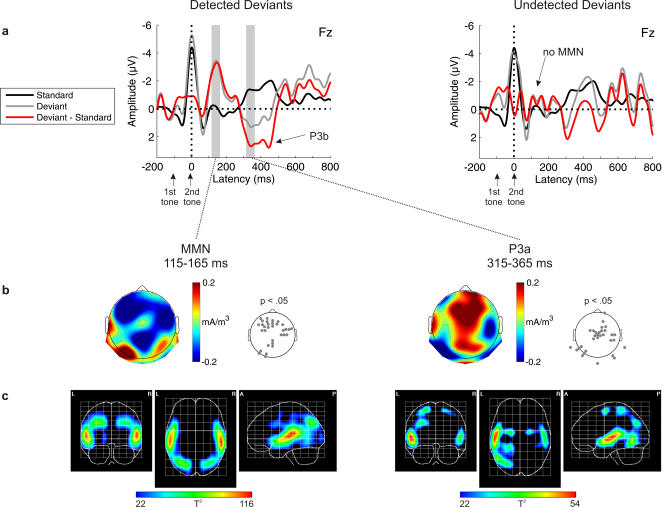
Figure 3. Detection condition for abstract rules.
a) Grand-average ERPs elicited by standards (black) and deviants (gray), and deviant minus standard difference wave (red) according to detection performance (detected deviants, left; undetected deviants, right). Note that the ERPs for undetected deviants are noisier because for some subjects, only few trials with undetected deviants were observed. However, exclusion of those subjects does not change the results, i.e. MMN is still not present for undetected deviants. b) Topographic distributions of the MMN and P3a components for detected deviants (scalp current density, SCD). Electrode positions with SCD values significantly deviating from zero are indicated in the p-value maps. c) Tomographic distributions of the MMN and P3a components for detected deviants (primary current density, PCD). The hotter colors correspond to higher probability values (one-way ANOVA; thresholded to p<.0001).

