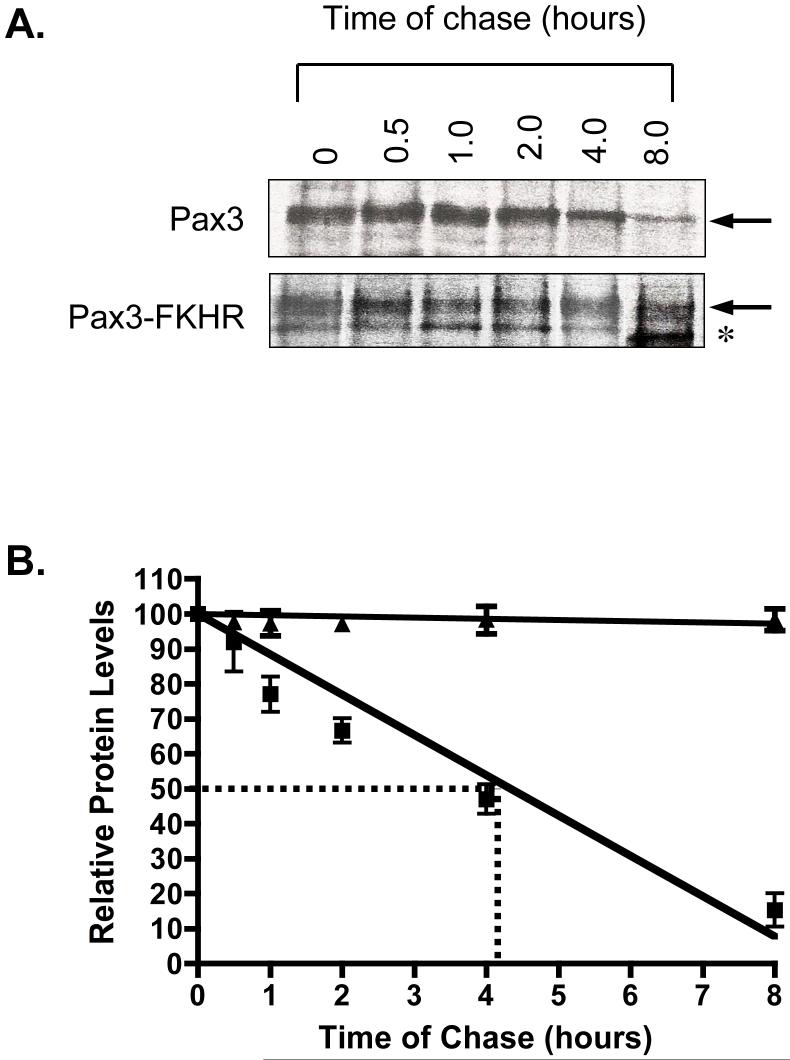
Figure 4.
Pulse-chase analysis of Pax3 and Pax3-FKHR at twenty-four hours of differentiation. A. Representative pulse-chase analysis of Pax3 and Pax3-FKHR from primary myoblasts induced to differentiate for twenty-four hours. After twenty-four hours of differentiation pulse-chase analysis was performed to determine the stability of the proteins, as described in the Materials and Methods. B. The protein levels of Pax3 and Pax3-FKHR observed in panel A were quantified by densitometric analysis and normalized for the amount of total cell lysate used for the immunoprecipitation. The normalized values of Pax3 (squares) and Pax3-FKHR (triangles) for each time point were plotted relative to the level of radiolabeled protein present at the 0 hour time point, which was given a relative value of 100%. The dotted line indicates the half-life for Pax3 as determined from the graph. The errors bars indicate the standard deviation from the mean for the average of three independent determinations.

