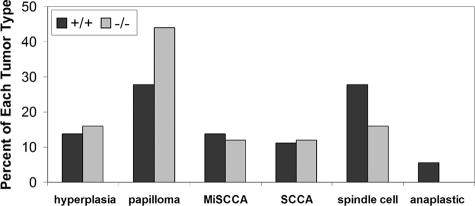
Figure 5.
As shown in this graph of the proportion of tumor types for each genotype, Snai2-null mice developed fewer aggressive spindle cell and anaplastic tumors than +/+ mice. The two genotypes developed similar proportions of miSCCs and SCCs. Differences in lesion distribution between the two genotypes were not significant when compared by χ2 analysis.

