Figure 5.
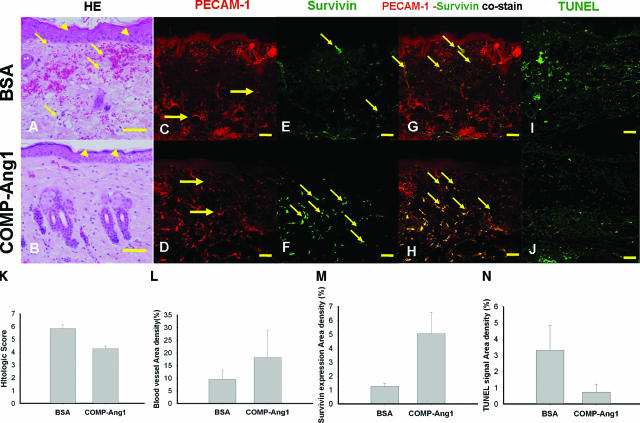
H&E, PECAM-1, survivin, and TUNEL stains at POD 5. A and B: Representative photographs of H&E staining of grafts. The epidermis (arrowheads) of the BSA group showed more spongiosis than that of the COMP-Ang1 group. The inflammatory cells (arrows) were shown at the dermal layer on BSA group. The COMP-Ang1 group showed better results than the BSA group on histological status of PECAM-1 (red) immunostain (C and D) and survivin (green) immunostain (E and F). In PECAM-1 and survivin co-stains (G and H), the BSA group mainly showed co-staining points (arrows) of PECAM-1 and survivin in the reticular dermal vasculature, but the COMP-Ang1 group showed co-staining points (arrows) of PECAM-1 and survivin in the entire dermal vasculature. TUNEL stain (I and J) and the bar graph (N) show that the overall apoptosis densities (arrows) in the COMP-Ang1 group were 4.46-fold less than those observed in the BSA group. K: The bar graph showed the histological scoring of both treatment groups. The COMP-Ang1 group showed better results than the BSA group on histological status. L: The bar graph shows that the overall blood vessel densities in the COMP-Ang1 group were 1.91-fold greater than those observed in the BSA group. M: The bar graph shows that overall survivin expression densities on endothelial cells in the COMP-Ang1 group were 3.96-fold greater than those observed in the BSA group. Scale bars = 2 mm. Original magnifications, ×200 (C–F); ×400 (A and B).

