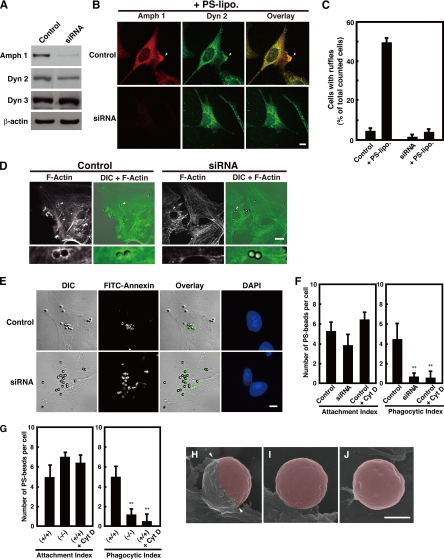
Figure 4.
Amphiphysin 1 is required for PS-stimulated membrane ruffling, actin polymerization and phagocytosis. (A) Control siRNA or siRNA for amphiphysin 1 was transfected into Ser-W3 cells. After 48 h, cells were lysed, and 20 μg of lysate was subject to Western blotting by using anti-amphiphysin 1 antibodies (mab3). Dynamin 2, dynamin 3, and β-actin were used as the controls. (B) Control cells and cells treated with amphiphysin 1 siRNA were stimulated with PS liposomes at 0.25 mM at 37°C for 10 min. Cells were labeled with anti-amphiphysin 1 (mab 3) (left) or dynamin 2 (middle) antibodies. The samples were analyzed by fluorescent confocal microscopy. Bar, 10 μm. (C) The number of cells, which were positive for ruffles, was determined and expressed as a percentage of the total number of cells analyzed. One hundred cells in 10 independent fields were counted in each experiment. All results represent the mean ± SEM from the three experiments. (D) Amphiphysin 1 RNAi inhibits actin polymerization during phagocytosis. Control cells or siRNA-treated cells were incubated with PS beads at 37°C for 90 min. Cells were labeled with Alexa488-phalloidin. The samples were analyzed by phase contrast and fluorescent confocal microscopy. PS beads are indicated by arrowheads and are shown at high magnification (bottom). F-actin is observed around the bound beads in control cells (left). The actin polymerization in siRNA-treated cells was barely seen (right). Control cells displayed actin polymerization with ∼67.5 ± 10.7% of the associated beads. In contrast, the polymerization occurred with only 10.2 ± 4.0% of associated beads in siRNA-treated cells. (For both treatments, n = 90 cells, from three independent experiments). Bar, 10 μm. (E) Effect of RNAi on amphiphysin 1 in PS-dependent phagocytosis. Control cells and siRNA-treated cells were incubated with PS beads for 6 h at 37°C, and then washed. Control cells were pretreated with Cyt D at 2 μM for 30 min as negative control. Cells were incubated with FITC-annexin at room temperature for 10 min before fixation to determine the level of bead internalization. Bar, 10 μm. (F) Quantitation of levels of phagocytosis in control cells or siRNA-treated cells. Annexin-positive and -negative beads were counted on the cell surface by using phase contrast and fluorescent confocal microscopy. The number of internalized beads was determined in 50 randomly chosen cells from 10 independent fields. Phagocytic index was quantified as the number of annexin-negative beads per cell. The attachment index was determined by counting the number of annexin-positive beads per cell. All results are reported as means ± SEM from three experiments. Statistical significance was determined by Student's t tests (**p < 0.01). (G) Phagocytic activity in the amph 1 (+/+) or amph 1 (−/−) primary cultured Sertoli cells. Cells were processed for phagocytic activity as described in F. Cells from amph 1 (+/+) were pretreated with Cyt D for 30 min at 32°C as negative control. Results are reported as means ± SEM from three experiments. Statistical significance was determined by Student's t tests (**p < 0.01). (H–J) We performed scanning electron microscopy to determine PS-dependent phagocytosis in primary cultured mouse Sertoli cells. Sertoli cells from amph 1 (+/+) or amph 1 (−/−) mice were fixed after 90 min of incubation with PS beads and then imaged. Cells from amph 1 (+/+) were pretreated with Cyt D for 30 min at 32°C as negative control. In amph 1 (+/+) Sertoli cells, phagocytic cups were evident (H, arrowheads). In contrast, the amph 1 (−/−) Sertoli cells displayed incomplete membrane extension and demonstrated low abilities to engulf the beads (I). Similarly, phagocytic cup formation was not observed in Cyt D-treated wild-type Sertoli cells (J). In this image, beads were highlighted using Adobe Photoshop CS2. Bar, 1.5 μm.

