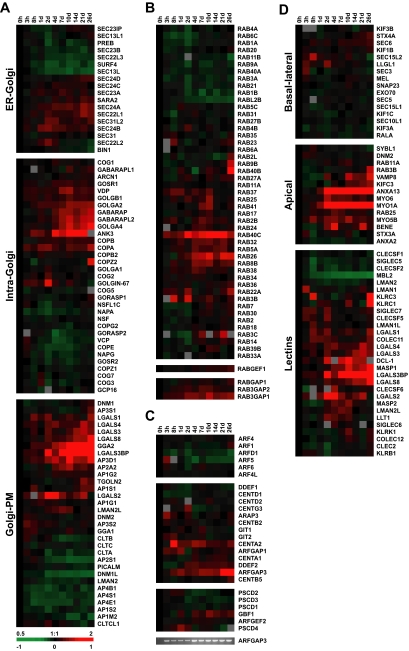
Figure 9.
Expression profiles of individual trafficking components. (A) Hierarchical gene expression clusters of the ER-Golgi, intra-Golgi, and Golgi-PM steps of protein trafficking. (B) Rab, RabGEF, and RabGAP gene expression clusters. (C) Arf and ArfGEF and GAP mRNA profiles during polarization. DNA gel shows verification of ARFGAP3 profile by RT-PCR. (D) Clustering of transcripts encoding trafficking pathway components based on basal-lateral or apical (lectins are separated out from the other apical targeting factors for clarity) targeting functions. Transcript levels determined by microarray analysis are shown relative to a reference pool of human mRNAs.

