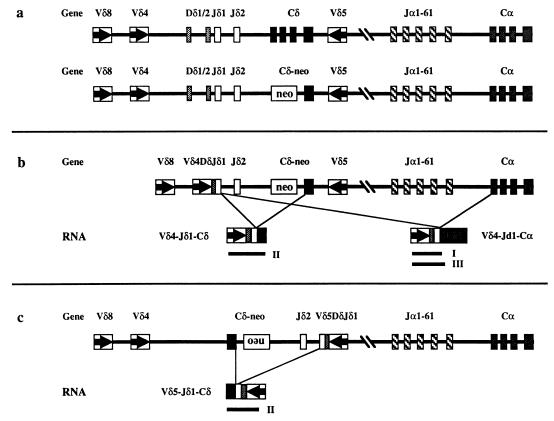
Figure 1.
(a) Schematic map of the TCRα/δ locus (not to scale). Boxes represent the various coding sequences. For the C genes, boxes are used to indicate each of the four exons. Arrows within the V gene boxes indicate transcriptional orientation. The top and bottom lines depict the wild-type and TCRδ-deficient loci, respectively. (b) An example of a V gene (Vδ4) rearrangement that can generate VDJδ1-Cα transcripts on the TCRδ-deficient locus. Lines indicate the two potential splicing events that can give rise to the two distinct mRNA species shown below the locus. Solid lines indicate the three RT–PCR products (marked as I, II, and III) that are detected in Fig. 4. (c) An example of a V gene (Vδ5) rearrangement that cannot generate VDJδ1-Cα transcripts on the TCRδ-deficient locus. Note the reverse transcriptional orientation of the assembled Vδ5DJδ1-Cδ region generated by the chromosomal inversion. Lines indicate the only potential splicing event that can give rise to the Vδ5DJδ1-Cδ mRNA shown below the locus and the solid line indicates the only RT–PCR product (marked as II) that can be detected (data not shown).

