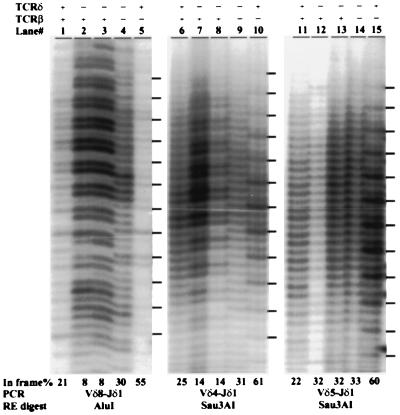
Figure 3.
PCR RFLP analysis of Vδ4, Vδ5, and Vδ8 to DJδ1 rearrangements. DNA samples from total thymi with the indicated genotype (+/+ or −/− for the TCRδ and/or TCRβ loci) were PCR-amplified and digested with the indicated restriction enzymes. Dashes on the right mark the position of the in-frame joints as determined from TCRβ-deficient mice which have only γδ TCR selected cells (14). The percentage of in-frame rearrangements is shown below each lane. Two individual TCRδ samples are shown.

