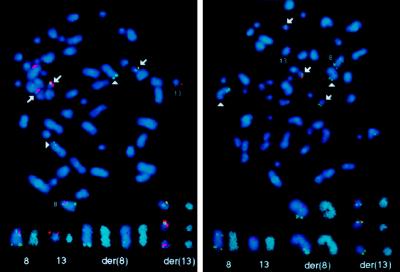
Figure 2.
Mapping of the chimeric FIM/FGFR1 and FIM cDNAs. FISH analyses were done on metaphase spreads from SCID t(8;13) cells. These cells contain two der(8) and three der(13). FISH analyses done using the FIM/FGFR1 (clone 28) and wild-type FIM (clone FIM#3) cDNAs are presented in the Left and Right panels, respectively. Normal chromosomes 8 and 13 are indicated, and arrows point to der(13), arrowheads to der(8). Isolated chromosomes counterstained in blue with 4′,6-diamidino-2-phenylindole dihydrochloride and image processed with a sharpen filter to increase the chromosome banding resolution are shown at bottom (at right in each pair).

