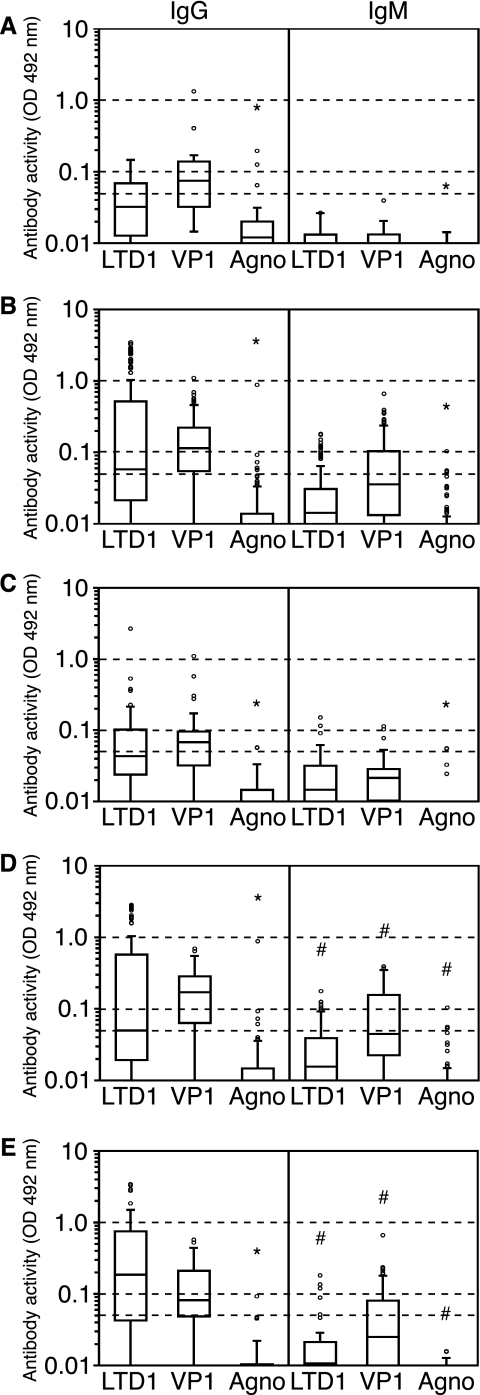
FIG. 3.
Antibody responses to BKV proteins in HD and KT patients. Box-and-whiskers plots, with the length of each box corresponding to the interquartile range and the upper and lower boundaries of the box representing the 75th and 25th percentiles, respectively, are shown. The line in the box indicates the median value. Dashed horizontal lines show the different cutoff levels for antibody activity. *, significant difference (P = 0.02) for anti-agnoprotein activity compared to activity against LTD1 or VP1; #, significant activity difference (P < 0.02) for all the antigen groups (Kruskal-Wallis test). (A) Anti-BKV antibody activity in healthy donors (19 samples from 16 participants). (B) Anti-BKV antibody activity in all renal transplant recipients (146 samples from 38 patients). (C) Anti-BKV antibody activity in renal transplant recipients without evidence of BKV replication or prior to the development of PVAN (25 samples from 16 patients). (D) Anti-BKV antibody activity in renal transplant recipients with ongoing PVAN (83 samples from 27 patients). (E) Anti-BKV antibody activity in renal transplant recipients after resolution of PVAN (38 samples from 23 patients).

