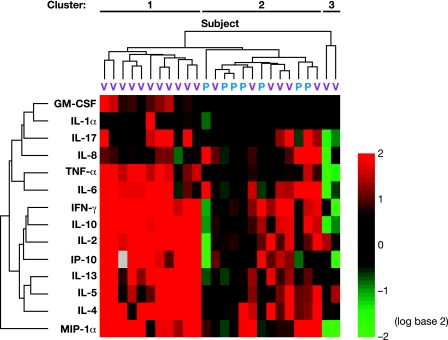
FIG. 2.
Two-dimensional cluster analysis of cytokine/chemokine profiles produced in response to incubation with HPV16 L1 VLP. The top dendrogram represents the similarity between cytokine profiles of different subjects, and the left dendrogram represents the similarity between measured cytokines/chemokines. Differences in relative levels of gene expression are indicated in color, where red indicates upregulation and green indicates downregulation relative to the corresponding gene expression in prevaccination samples. Each row represents the values for a cytokine, and columns correspond to patients (blue label, placebo; pink label, vaccine recipient).

