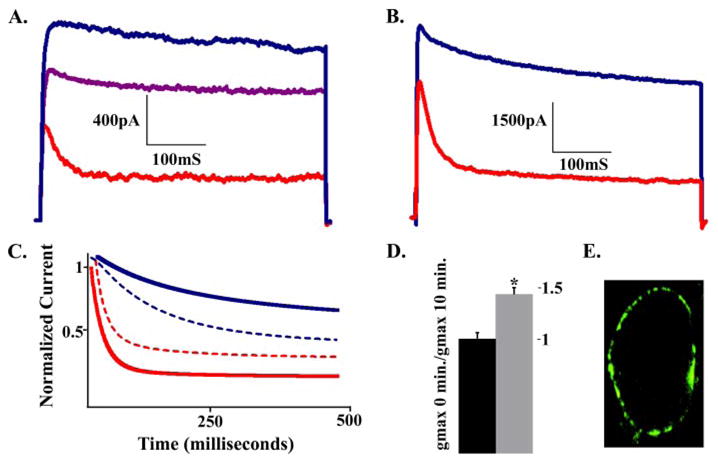
FIGURE 1. Arachidonic acid negatively regulates β-cell Kv2.1 channel activity.

A, Kv currents from an INS-1 cell recorded at +60 mV before (blue trace) or after (red trace) 10 min of incubation with 5 μM arachidonic acid or 15 min (purple trace) after washout of arachidonic acid. B, Kv currents recorded from a HEK cell expressing Kv2.1 at +60 mV before (blue trace) and 10 min after (red trace) incubation with 10 μM arachidonic acid. C, decay curves of Kv current traces from INS-1 cells at +60 mV before (blue line) or after (red line) incubation with 5 μM arachidonic acid. Dashed lines represent standard errors of the mean (n = 7). D, Gmax changes before and after INS-1 incubation with vehicle (black bar) or arachidonic acid (gray bar); displayed values are the mean ± S.E. (n = 7, p < 0.05). E, immunoflouroscent confocal-microscropic localization of a Kv2.1-GFP construct expressed in HEK cells.
