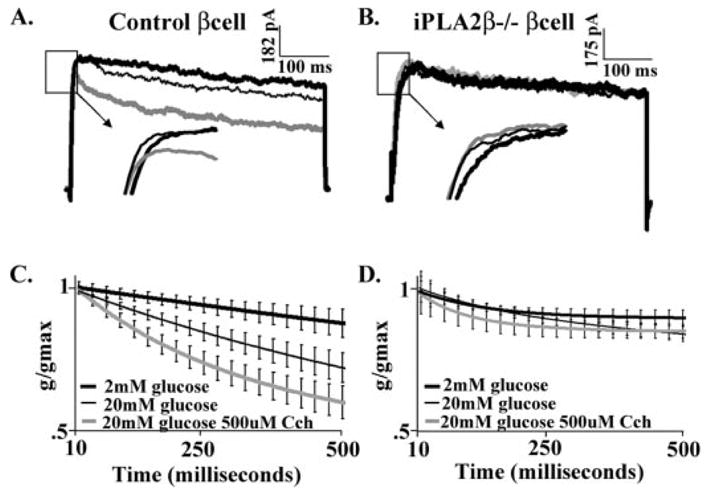
FIGURE 6. Delayed rectifier currents from iPLA2β−/− and control mouse β-cells.

A, Kv currents recorded from a control mouse β-cells treated with 2 mM glucose (thick black line), 20 mM glucose (thin black line), and 20 mM glucose and 500 μM carbachol (thick gray line) during a 500-ms step from −80 mV to −5 mV. B, Kv currents recorded from iPLA2β null mouse β-cell treated with 2 mM glucose (thick black line), 20 mM glucose (thin black line), and 20 mM glucose and 500 μM carbachol (thick gray line) during a 500-ms step from −80 mV to −5 mV. Insets of A and B depict the expanded current traces from their respective boxed areas. C and D, Kv current decay curves from control (C; n = 8) and iPLA2β null (D; n = 7) β-cells cells treated with 2 mM glucose (thick black line), 20 mM glucose (thin black line), and 20 mM glucose and 500 μM carbachol (thick gray line), ± S.E. black bars.
