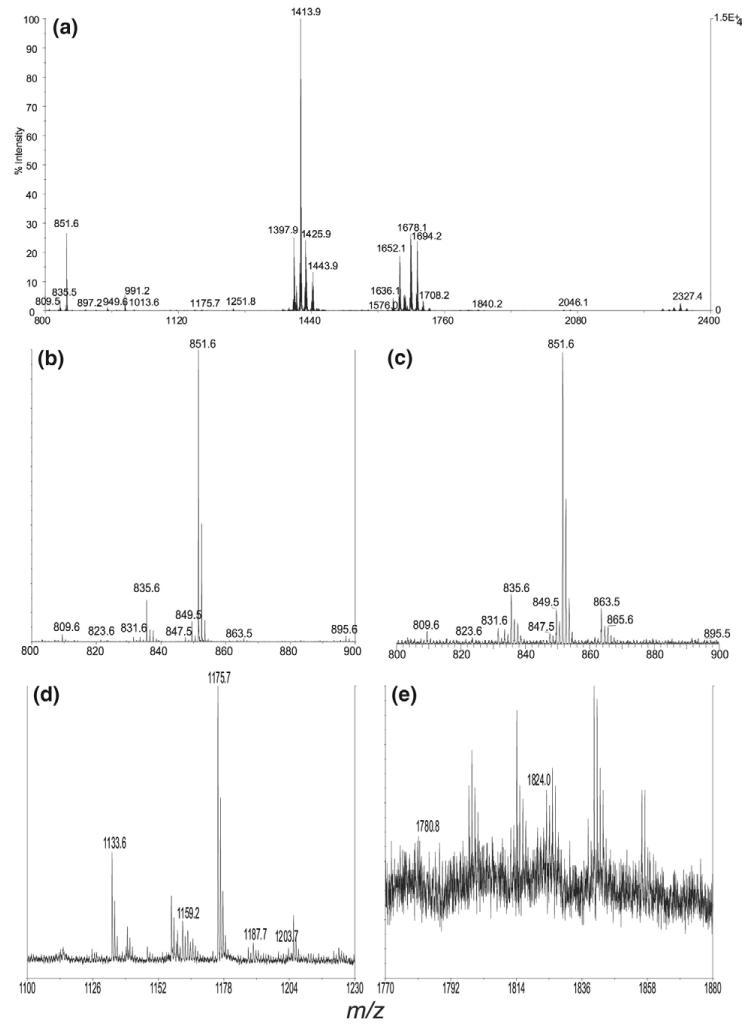
Figure 1.
(a) The MALDI/TOF mass spectrum of the PIMs isolated from Mycobaterium bovis BCG. The ions that represent (b) the PI species (from 800 to 900 Da), (d) the PIM2 species (from 1100 to 1230 Da), and (e) the PIM6 species (from 1770 to 1880 Da) are also shown. The ESI/MS spectrum of the PI ions (c) is nearly identical to that shown in (b).

