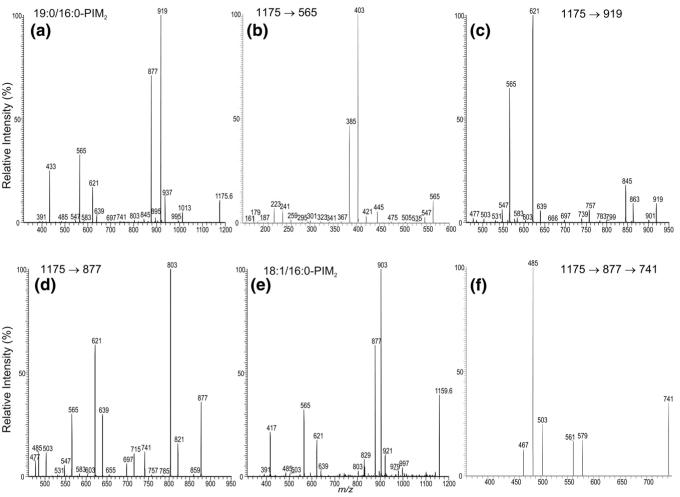
Figure 4.
The IT MS2 spectrum of the [M – H]− ion of 19:0/16:0-PIM2 at m/z 1175 (a) and its IT MS3 spectra of the ions at m/z 565 (1175 → 565) (b), at m/z 919 (1175 → 919) (c), at m/z 877 (1175 → 877) (d), and the MS4 spectrum at m/z 741 (1175 → 877 → 741) (f). Panel (e) shows the IT MS2 spectrum of the [M – H]− ion of 18:1/16:0-PIM2 at m/z 1159.

