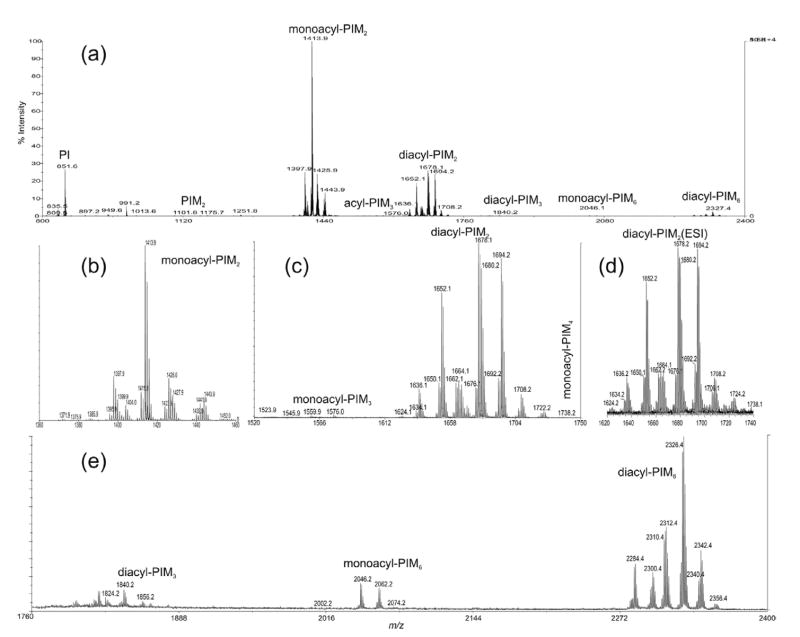
Figure 1.
The MALDI-TOF mass spectrum of the complex lipid extract from M. bovis BCG (a), and the separate mass spectra that represent monoacyl-PIM2s (b), monoacyl-PIM3s and diacyl-PIM2s (c), and diacyl-PIM3s, monoacyl-PIM6s and diacyl-PIM6s (e). The profile of the high-resolution ESI mass spectrum of diacyl-PIM2s as shown in (d) is identical to that shown in (c).

