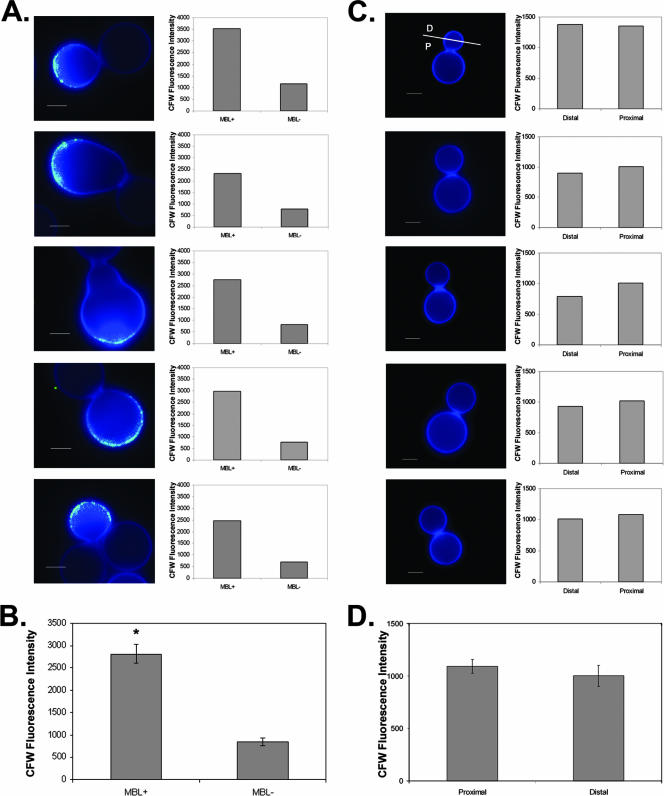
FIG. 6.
(A) Colocalization of MBL staining with regions of increased calcofluor white intensity. The average intensity of calcofluor white staining in regions positive for MBL staining was compared to the intensity of calcofluor white staining in MBL-negative regions. Scale bars = 2.5 μm. (B) Graph of pooled data from the five cells shown in panel A (P < 0.0005). (C) Wild-type cells exhibit uniform calcofluor white staining. The average intensity of calcofluor white staining was measured for the half of a bud proximal to the bud scar (P) and for the half of a bud distal to the bud scar (D) for each of five budded wild-type cells. (D) Graph of pooled data from the five cells shown in panel C (P = 0.24). CFW, calcofluor white.

