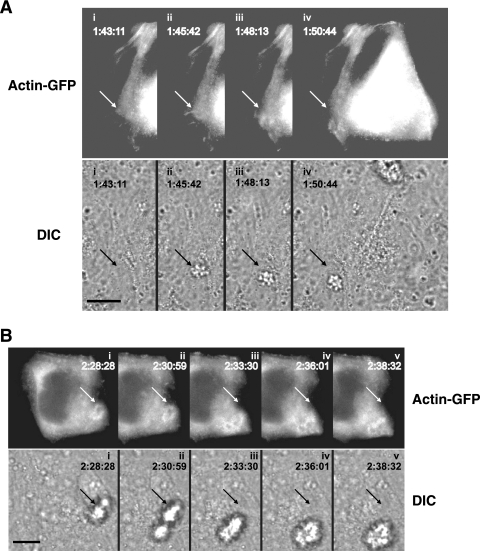
FIG. 4.
Positions of actin-GFP plaques relative to a moving microcolony. Time-lapse images (see Video S2 in the supplemental material) were compiled to show two different actin-GFP-expressing A431 epithelial cells with infecting wt MS11 microcolonies. The time stamps indicate the times of image acquisition in hr:min:s. (A) Clustering of actin-GFP at the site of entry of a microcolony. (Top) Successive FITC images showing actin-GFP clustering in the cell. Directly below each FITC image is the corresponding DIC image, presented to show the position of the microcolony. Frame i was acquired prior to entry of the microcolony onto the cell. The arrow points to the entry site of the microcolony; its position in all frames is invariant. (B) Movement of actin-GFP plaque relative to the position of a motile microcolony. (Top) Successive FITC images of another infected cell showing the positions of the actin-GFP plaque. Directly below each FITC image is the corresponding DIC image showing the positions of the microcolony. The arrow in each panel points to the original position of the microcolony; its position in all frames is invariant. Scale bar, 10 μm.

