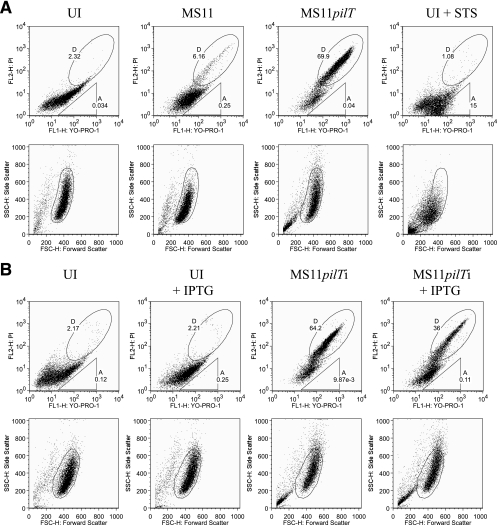
FIG. 7.
Dual-fluorescence flow cytometry analysis of cell death in N. gonorrhoeae-infected cultures. (A) A431 cells were mock infected with medium (UI), infected with wt MS11 or MS11pilT for 5.5 h, or treated with STS for 4.5 h and analyzed by flow cytometry for YO-PRO-1 and PI staining (top row). (B) A431 cells were infected with MS11pilTi in the presence or absence of IPTG. Parallel mock-infected (UI) cultures were treated with IPTG or left untreated, as indicated (see Materials and Methods), and analyzed by flow cytometry for YO-PRO-1 and PI staining. The top rows in panels A and B contain bivariate dot plots of cells in each sample stained with these dyes. The number in gate A indicates the percentage of YO-PRO-1+ PI− cells in the population. The number in gate D indicates the percentage of YO-PRO-1+ PI+ cells. Below each sample is its corresponding scattergram (lower rows). The gated populations within each scattergram were used to plot PI fluorescence in relation to YO-PRO-1.

