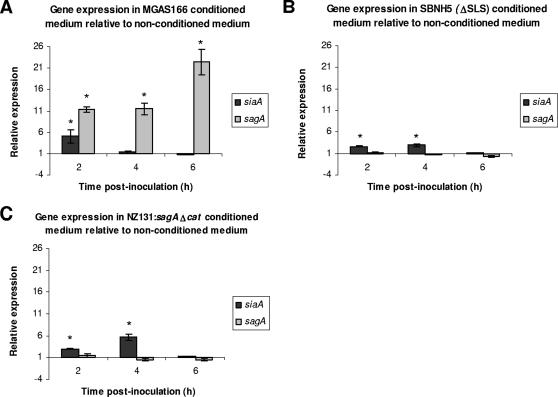
FIG. 3.
Expression of siaA and sagA during growth of MGAS166 in conditioned medium from MGAS166 (A), SBNH5(ΔSLS) (B), and NZ131:sagAΔcat (C) relative to nonconditioned medium as determined by real-time PCR analysis. Statistical significance (P < 0.05) as determined by a single factor ANOVA is indicated by the asterisk. Error bars indicate standard deviations.

