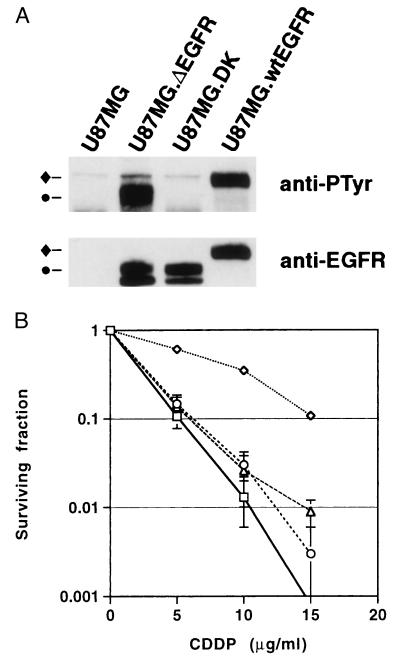
Figure 1.
(A) Quantitation of EGFR species in cells. Western blot analysis of expression (Lower) and autophosphorylation (Upper) of wt EGFR (♦) and ΔEGFR (•) in U87MG, U87MG.ΔEGFR, U87MG.DK, and U87MG.wtEGFR cells grown in medium containing 10% serum. Low and similar levels of endogenous wt EGFR expression also was detected in U87MG, U87MG.ΔEGFR, and U87MG.DK at longer exposures (data not shown). (B) Survival of U87MG (□), U87MG.ΔEGFR (⋄), U87MG.DK (○), and U87MG.wtEGFR (▵) cells in response to varying amounts of cisplatin (CDDP). Cells were plated in triplicate 60-mm dishes and treated with medium containing various concentrations of CDDP for 1 hr, followed by incubation with fresh medium for 10–12 days. Numbers of colonies were counted after Giemsa staining. Results were reproduced in four independent experiments. [Bars = SD (some bars are too small to be visualized).]

