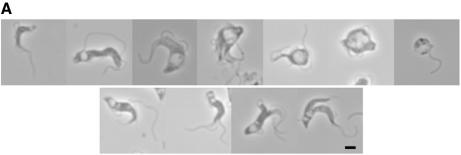
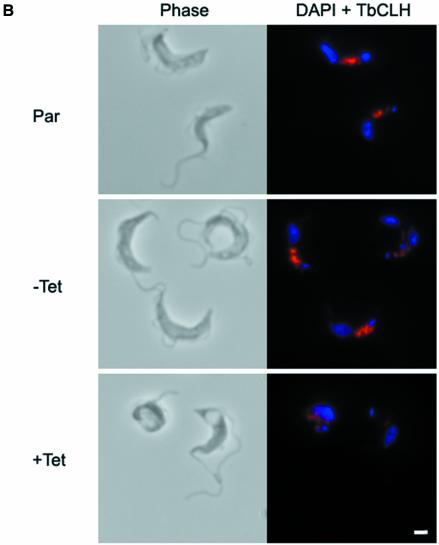
Fig. 1. Depletion of clathrin heavy chain leads to BigEye morphology. (A) Gallery of images from cultures expressing clathrin RNAi. The top line shows interphase cells with increased abnormality running from left to right. The majority of cells in early cultures correspond to the four leftmost images, whilst more severe phenotypes, as shown on the right, emerge and increase in prevalence in older cultures. The bottom line shows examples of mitotic cells exhibiting BigEye phenotype. In this case, more than one vacuole is present, and these are frequently of very different sizes (BigEye/LittleEye cells). Scale bar: 2 µm. (B) Immunofluorescence analysis demonstrates knockdown of clathrin expression following induction in bloodstream form (BSF) cells. Left, phase-contrast image; right, DAPI (blue) and anti-TbCLH stain (red). Par, BSF 90-13 parental cells; BSFp2T7TiCLH, RNAi cells uninduced (–Tet) and induced (+Tet). Scale bar: 2 µm.

An official website of the United States government
Here's how you know
Official websites use .gov
A
.gov website belongs to an official
government organization in the United States.
Secure .gov websites use HTTPS
A lock (
) or https:// means you've safely
connected to the .gov website. Share sensitive
information only on official, secure websites.

