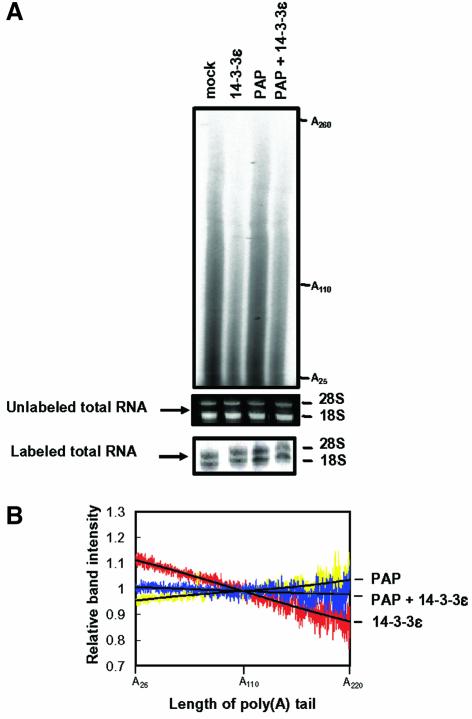
Fig. 7. Effect of overexpressing 14-3-3ε on the length distribution of poly(A) tails in vivo. (A) Total RNA was purified from NIH 3T3 cells transfected with the indicated constructs and labeled at the 3′ end with [32P]pCp. Total RNA from untranfected cells (mock) was also used as a control. We confirmed the quality of RNA by observing intact 28S and 18S rRNAs on the gels before and after the labeling. The labeled RNA was extensively digested with RNase A and RNase T1. The products were analyzed on a 5% sequencing gel. (B) RNA band intensities were determined by an image analyzer BAS-1500 (Fuji) and the sum of peak integration was normalized to that of control cells (mock). The relative intensity is represented as a ratio of the normalized intensity of the transfected cells to the intensity of control cells at a specific poly(A) length. The relative length distribution of poly(A) tails of mRNA isolated from cells transformed with GST poly(A) polymerase (PAP) (yellow). HA-14-3-3ε (red) or both GST–PAP and HA-14-3-3ε (blue) are shown. The black line represents a third-degree polynomial fit of each relative length distribution. The data are representative of three separate experiments.

An official website of the United States government
Here's how you know
Official websites use .gov
A
.gov website belongs to an official
government organization in the United States.
Secure .gov websites use HTTPS
A lock (
) or https:// means you've safely
connected to the .gov website. Share sensitive
information only on official, secure websites.
