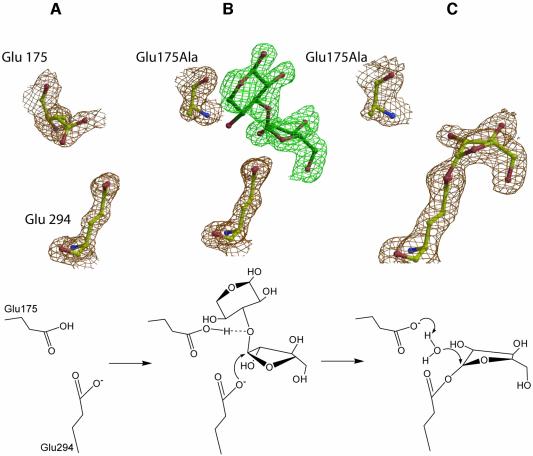
Fig. 8. Snapshots along the reaction pathway obtained from the X-ray structures (upper), and a schematic representation of the corresponding stages of the glycosylation step (lower). (A) The catalytic residues of the native AbfA. (B) Michaelis complex of the intact substrate Ara-α(1,3)-Xyl located in subsites –1 and +1. The absence of electron density at this contour level for the 4-OH of the xylose at the +1 subsite results from the heterogeneity of the substrate. The second xylose connected to only part of the substrate molecules probably distorts the O4 of the first xylose. (C) Structure of the trapped covalent arabinofuranosyl–enzyme intermediate. The 2DFo – mFc electron density maps are contoured at 1.5 σ.

An official website of the United States government
Here's how you know
Official websites use .gov
A
.gov website belongs to an official
government organization in the United States.
Secure .gov websites use HTTPS
A lock (
) or https:// means you've safely
connected to the .gov website. Share sensitive
information only on official, secure websites.
