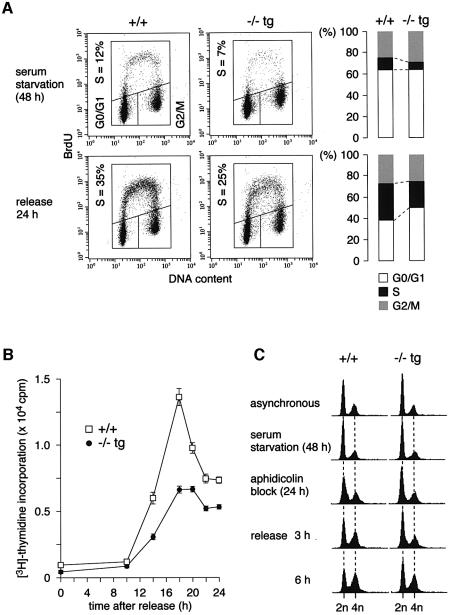
Fig. 3. Cdc7–/–tg MEFs exhibit delayed S phase entry and slowed S phase progression. (A) Cell cycle distribution of Cdc7–/–tg MEFs following serum starvation and release. The proportion of BrdU-positive cells was lower in the Cdc7–/–tg MEFs (25%) than in the wild-type MEFs (35%). The gate settings for cells in G0/G1, S and G2/M phases and percentage of cells in S phase are indicated. Consistent data were obtained from two independent experiments. (B) Incorporation of [3H]thymidine during 2 h pulses at indicated time points following release from serum starvation. The values represent average of three independent experiments. (C) FACS analysis for DNA content. The cells were sequentially arrested in G0 and early S phase by serum starvation and aphidicolin treatment, respectively. At the time of aphidicolin block, Cdc7–/–tg MEFs contain more G0/G1 cells, and at 3 and 6 h after release from the aphidicolin block, they contain less S phase cells than the wild-type (+/+) MEFs.

An official website of the United States government
Here's how you know
Official websites use .gov
A
.gov website belongs to an official
government organization in the United States.
Secure .gov websites use HTTPS
A lock (
) or https:// means you've safely
connected to the .gov website. Share sensitive
information only on official, secure websites.
