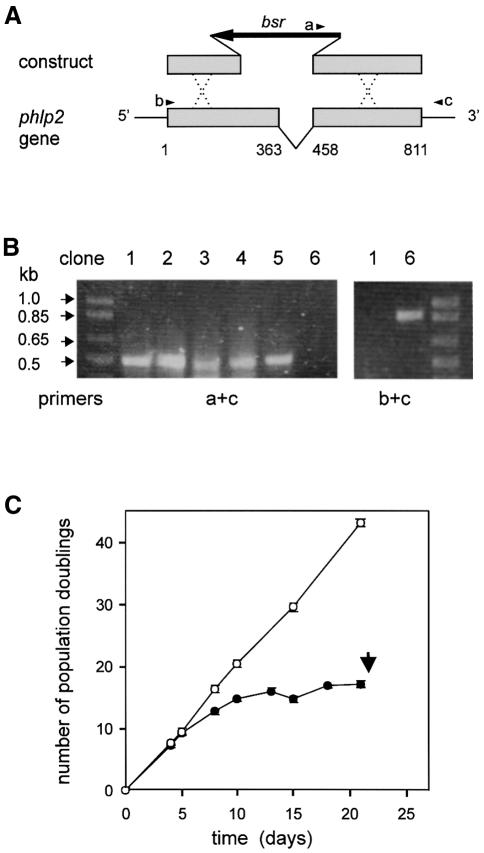
Fig. 2. Lethal phenotype of phlp2– cells. (A) Schematic of phlp2 gene disruption. The arrowheads denote the three primers used for PCR analysis. PCR primer c recognizes part of the 3′ untranslated region that is not present in the knockout construct. (B) Identification of phlp2 disruptants by PCR analysis. DNA was isolated from several clones ∼15 days after transformation; some of these clones died around day 22 (clones 1–5), while others remained viable (clone 6). PCR analysis using primer set a + c is predicted to yield a 503 bp product for a disrupted phlp2 gene and no product for an intact gene, while PCR analysis with primers b + c will yield an 893 bp product for the intact phlp2 gene. (C) Cell growth curve. The amount of cells was estimated at different days after transformation to calculate the number of population doublings. Data shown are the means and standard deviations of six phlp2– strains; the clones were identified as phlp2 gene disruptant by PCR on day 18–20 as shown in (B). The population-doubling kinetics for random integrants are identical with those of wild-type AX3 cells and are shown for comparison. The results reveal that initially the doubling time of phlp2– cells (closed circles) is about the same as that of random integrants (open circles) but gradually increases until cells stop dividing and die after 3 weeks (arrow).

An official website of the United States government
Here's how you know
Official websites use .gov
A
.gov website belongs to an official
government organization in the United States.
Secure .gov websites use HTTPS
A lock (
) or https:// means you've safely
connected to the .gov website. Share sensitive
information only on official, secure websites.
