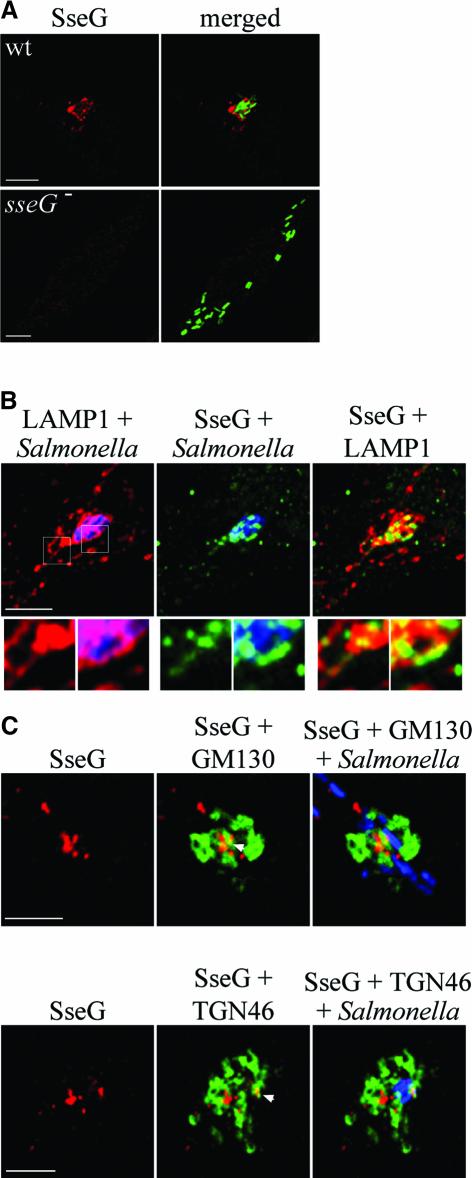
Fig. 3. Intracellular distribution of SseG in HeLa cells. (A) Confocal immunofluorescence microscopy of HeLa cells infected for 10 h by GFP-expressing wild-type strain or the sseG mutant as a control. Cells were labelled with the anti-SseG antibody (red). Scale bars correspond to 5 µm. (B) Confocal immunofluorescence microscopy of HeLa cells infected for 10 h by wild-type S.typhimurium. Boxed areas shown in higher magnification below show co-localization between SseG (green) and LAMP1 (red) on a Sif and SCV membrane. Salmonella typhimurium was labelled with an anti-Salmonella antibody (blue). Punctate labelling of SseG can also be seen in the vicinity of the microcolony. Scale bar corresponds to 5 µm. (C) Distribution of SseG in relation to the Golgi network in HeLa cells infected for 10 h with wild-type bacteria (blue in merged image). Arrowheads indicate points of co-localization between SseG (red) and either GM130 (green, upper panel) or TGN46 (green, lower panel). Scale bars correspond to 5 µm.

An official website of the United States government
Here's how you know
Official websites use .gov
A
.gov website belongs to an official
government organization in the United States.
Secure .gov websites use HTTPS
A lock (
) or https:// means you've safely
connected to the .gov website. Share sensitive
information only on official, secure websites.
