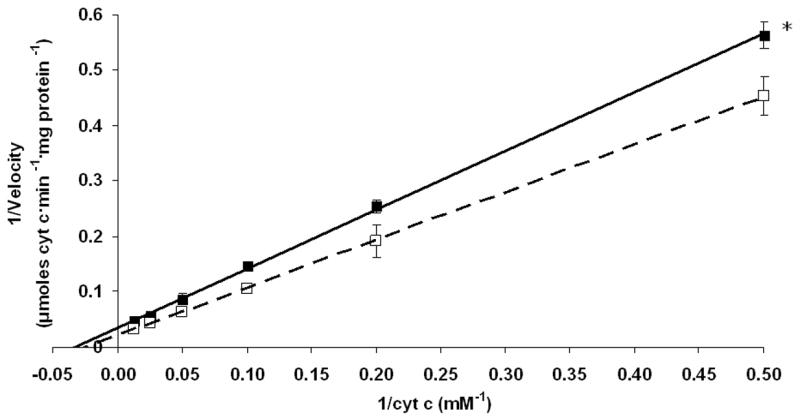
Figure 1. Lineweaver-Burk plot of myocardial CcOX kinetic activity.

The plot depicts CcOX kinetic activity following exposure to 1000 ppm CO (closed squares with solid line) or compressed air (open squares with dashed line). Lines indicate best-fit linear regression for each data set: x- intercept represents -1/Km; y- intercept represents 1/Vmax. *p < 0.01.
