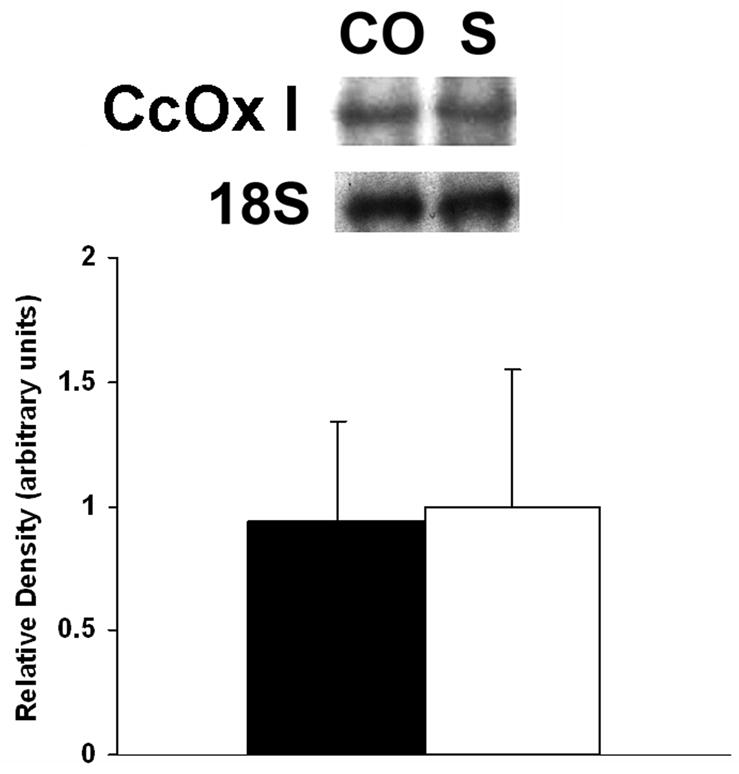
Figure 3. Northern blot hybridization of CcOX I.

Above: A representative blot from one group of animals is depicted. CO = CO exposed group; S = sham exposure. 18S = ribosomal subunit. Below: graphic depiction of normalized signal densities. Closed bars = CO exposed mice; open bars =sham controls. Data are means +/− st dev. Values normalized to the density of the 18S ribosomal subunit. Sham densities arbitrarily set to 1. p = NS.
