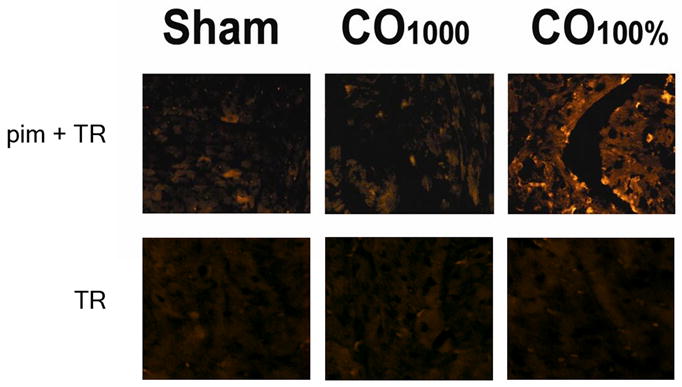
Figure 5. Assessment for myocardial tissue hypoxia using immunohistochemistry for pimonidazole hydrochloride.

Representative sections from mice exposed to air (sham), mice exposed to 1000 ppm CO (CO0.1%), and from mice exposed to 100% CO (hypoxic controls, CO100%) are demonstrated. The upper panels represent sections exposed to primary antibody to pimonidazole and secondary antibody conjugated with Texas red (pim + TR). The lower panels are control sections from the representative groups exposed only to antibody conjugated with Texas red (TR). Sections were imaged using fluorescence microscopy at 20X with 596 nm excitation and 620 nm emission. Fluorescence patterns are similar between CO0.1% and normoxic sham controls. These were similar to TR control sections. However, regions of bright fluorescence are clearly seen in CO100% hypoxic controls.
