
Figure 2.
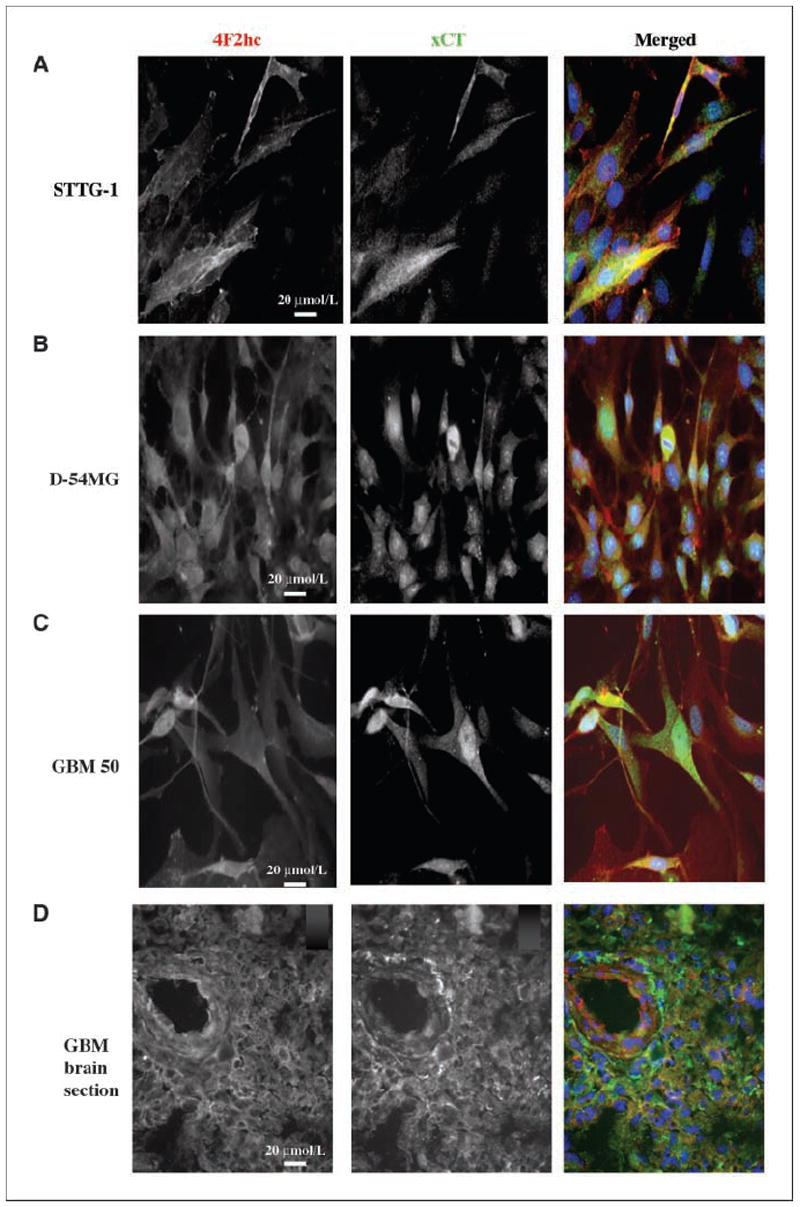
Specificity of system subunits show antibody binding in the membranes of glioma cells. A, sister coverslips of glioma cell lines were stained with mouse anti-4F2hc and rabbit anti-xCT. Both fluorescence channels are shown separately in black and white until merged in the third color panels. A to D, merged images: red, xCT; green, 4F2hc; blue, DAPI, a nuclear stain. The GBM-stained patient section is shown in D, where xCT is green and 4F2hc is red. Merged images were taken at the exposure time appropriate for each wavelength. All images were taken at ×40 magnification.