Figure 6.

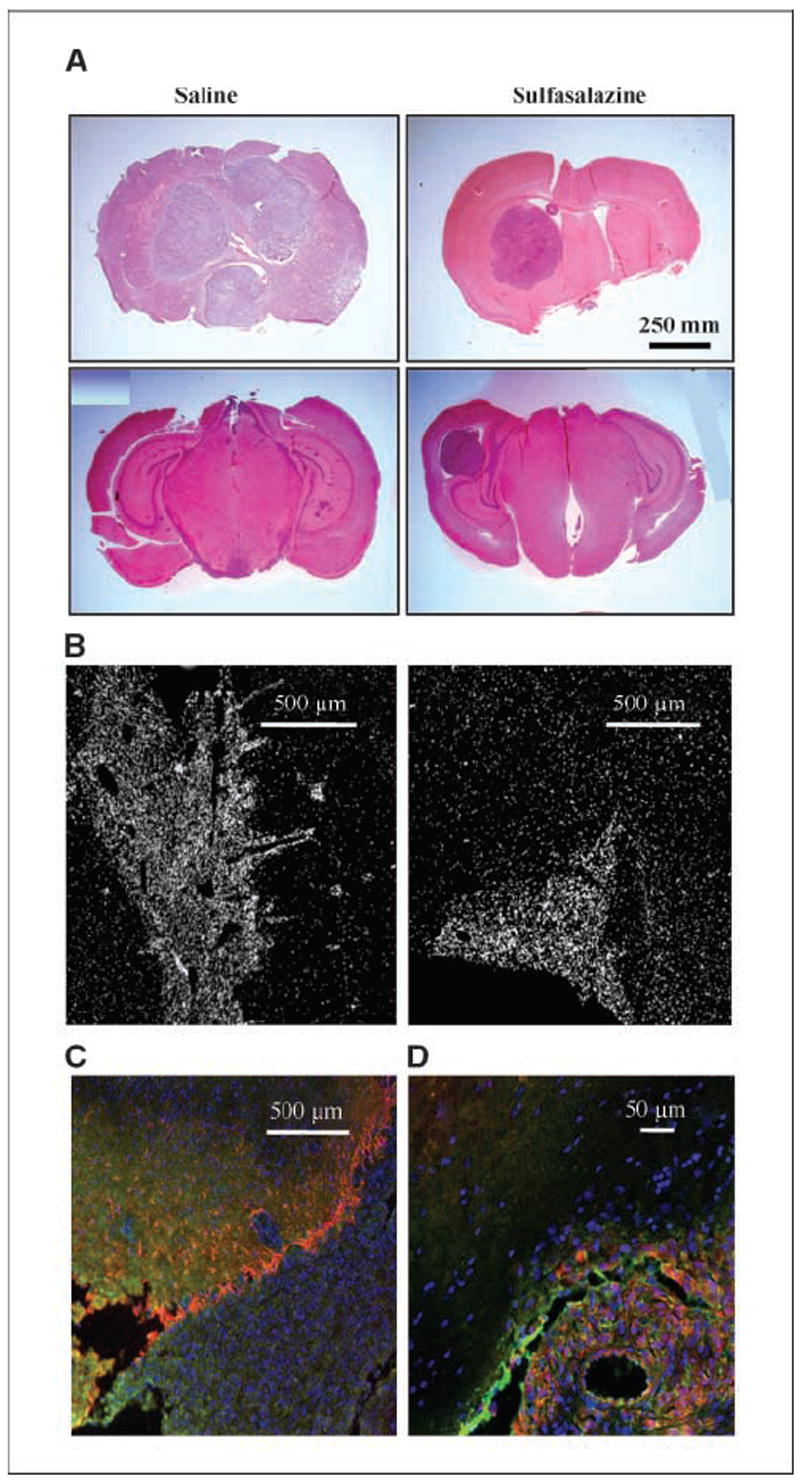
Glioma invasion of tumor growth in the mouse glioma model is inhibited by sulfasalazine. A, glioma xenographed mice brains were sectioned for H&E staining to identify tumor regions. Left, tumor formation in two saline-treated mice. Right, two SAS-treated brains. Top row, tumor formation at 25 d posttumor injection; bottom row, tumor formation at 21 d posttumor injection. B, fluorescent images of DAPI-labeled nuclei show densely populated tumor formation in brain sections of saline and SAS-treated mice. C, merged GLT-1–, GFAP-, and DAPI-stained brain slice shows astrocytes lining the tumor perimeter. D, merged system staining in tumor is shown in sulfasalazine-treated mouse brain section.
