Figure 1.
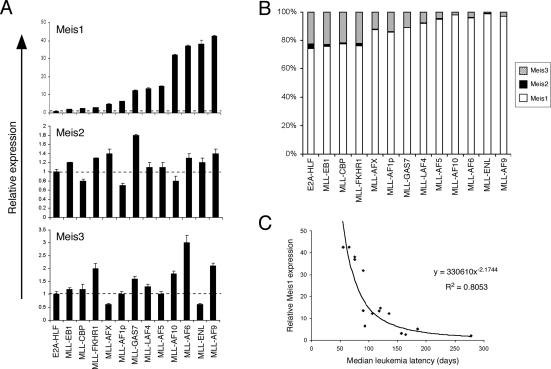
Meis1 expression levels correlate with the latencies of MLL leukemias. (A) The expression levels of Meis1, Meis2, and Meis3 transcripts were determined by real-time PCR analysis of MLL-transformed cells (indicated below) from the fourth round of serial replating (error bars indicate standard deviations of triplicate analyses). Results are expressed relative to levels observed in cells transformed by E2A-HLF (dashed line). (B) Bar graph indicates the total relative levels of Meis transcripts expressed in cells transformed by various oncogenes (indicated at bottom) from the fourth round of plating in methylcellulose cultures. The relative abundance of Meis transcripts was determined using the cycle time (Ct) value method, assuming that all primers were optimized to generate equal PCR efficiencies. (C) The relative expression levels of Meis1 are plotted against median latency times required for leukemia induction by the respective MLL oncogenes. Latency data are derived in part from the current study as well as published studies (Supplementary Table 1). The data display a power trend line best-fit (R2 = 0.8053) indicating that Meis1 expression levels decrease at a specific rate with respect to the time required for leukemia development.

