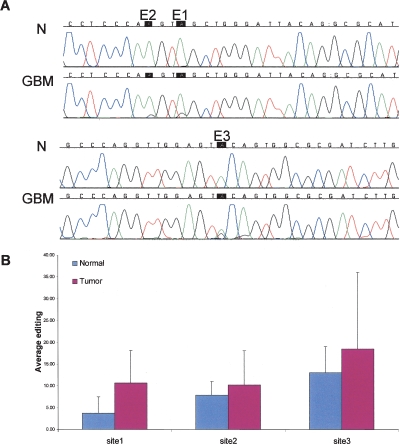
Figure 2.
Elevated editing levels in BRCA1 transcript in brain tumor vs. normal tissues; editing sites in an Alu element in the second intron of the BRCA1 gene. (A) Direct sequencing of the BRCA1 transcripts from representative samples taken from normal (N) and glioblastoma multiforme (GBM) brain tissues. A-to-I editing is detected as guanosine trace and indicated by a black box. (B) Average editing levels in BRCA1 transcripts in normal (n = 9) and brain tumor (n = 29) tissues. Editing levels at site 1 are 2.9-fold higher (P < 0.04) in the cancerous tissues relative to the normal control (10.7% vs. 3.7%). Site 2 shows 1.3-fold higher editing efficiency (10.2% editing in brain tumors compared to 7.9% in the normal brains; P < 0.04). Similarly, site 3 presents 1.4-fold elevated editing level in the tumoral tissue (18.5% compared to 13.0%; P = of 0.04).

