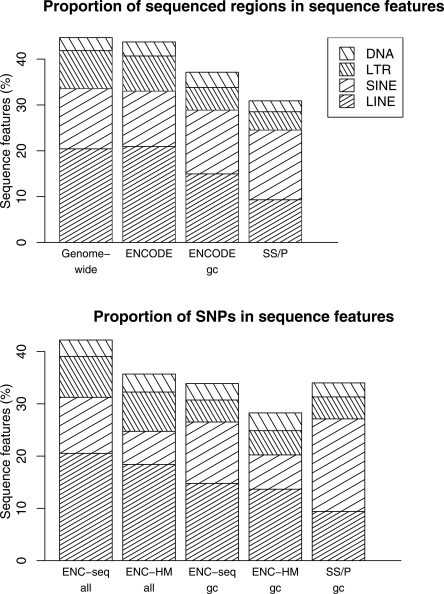
Figure 2.
Frequency distribution of local genomic characteristics in evaluation resources (%). The top and bottom panels show the proportion of sequenced region and the proportion of SNPs that fall into each category of sequence features. (gc) Gene-centric (within 10 kb of any known gene); (SS/P) SeattleSNPs/PARC; (ENC-seq) ENCODE SNPs submitted to dbSNP; (ENC-HM) SNPs genotyped by the ENCODE-HapMap project (http://www.hapmap.org/downloads/encode1.html.en). (LINE) Long interspersed element; (SIN) short interspersed element; (LTR) long terminal repeat retrotransposons; (DNA element) DNA transposons. Genome-wide averages are those published by Lander et al. (2001).

