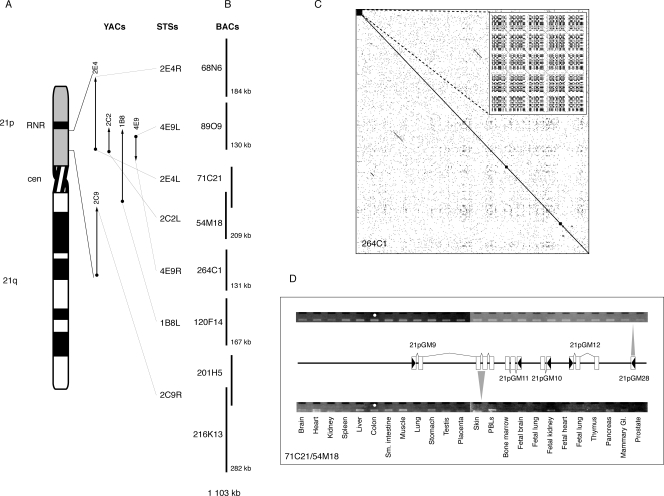
Figure 1.
Isolation and analysis of 21p BACs. (A) Location of YACs (Wang et al. 1999) and seven STS probes used for screening the CHORI-507 library. (B) Eight BACs identified with 21p STSs from the CHORI-507 library were sequenced. The order shown is based on the order of the STS probes. (C) Dotplot of BAC 264C1 shows that there are no large regions of satellite or highly repetitive sequence. (Inset) Magnification of the first 1500 bp shows that there is a small region of satellite III at one end of the clone. The pattern of satellite III as a variable number of (ATTCC) repeats separated by a ∼10-bp consensus (Prosser et al. 1986) can be seen. (D) Schematic of the five gene models identified within BACs 71C21/54M18. RT-PCR expression patterns of 21pGM9 and 21pGM28 are shown. White boxes represent exons; black arrowheads indicate transcription direction.

