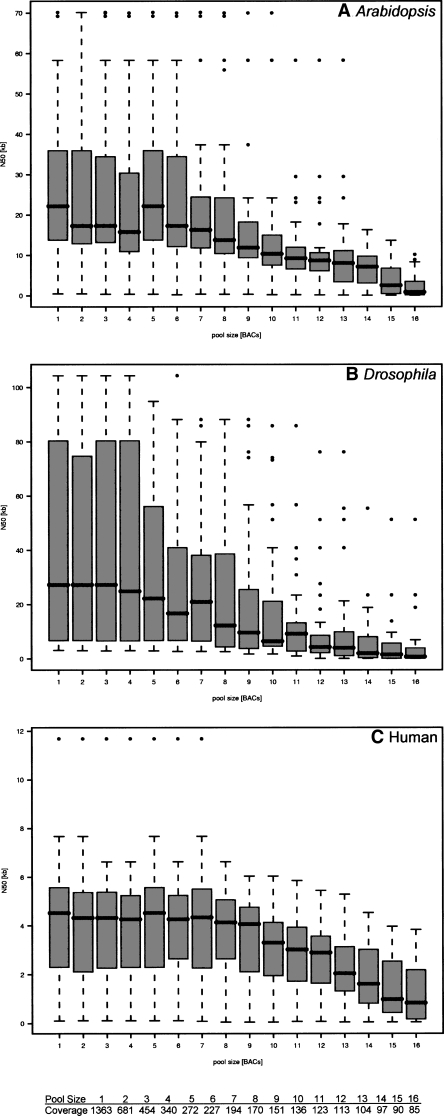
Figure 4.
Dependency of N50 on BAC pool size for three different species (A–C). The data shown were collected from assemblies under realistic assumptions, with an error rate of 0.6% per base call and reads generated from randomly chosen positions. We mimic the BAC pool size by generating the proportional number of reads, i.e., for pool size n, we generate 5 million/n reads per BAC, corresponding to a coverage of 1363/n. BAC pool sizes (1–16) and corresponding coverages are indicated at the bottom of the figure. For each species we used 20 BACs with average length 110 kbp and simulated 30-mer data sets three times per BAC. Thus, for each pool size distribution, 60 assembly results are shown using box plots. Boxes stretch from the first to the third quartile of the respective distribution and cover 50% of the corresponding data. The median inside each box is indicated with a line. Whiskers (dashed lines) are 1.5 times longer than the box but do not stretch beyond minima and maxima and are used to define the outliers (small circles).

