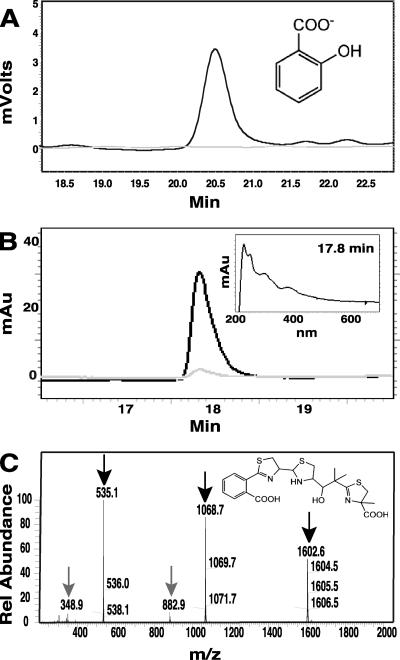
FIG. 1.
P. syringae pv. tomato DC3000 produces SA and Ybt under iron-limiting conditions. (A) Overlaid HPLC chromatograms showing SA extracted from iron-limited (black) and high-iron (gray) DC3000 cultures. Fluorescence at excitation of 305 nm and emission of 407 nm, optimal for SA, is shown. The structure of SA is shown in the upper right corner. (B) Overlaid HPLC chromatograms showing Ybt-Fe3+ with Ybt extracted from iron-limited (black) and high-iron (gray) DC3000 cultures, measured at a Ybt-Fe3+ absorbance maximum (385 nm). Extracted Ybt and Ybt-Fe3+ was saturated with Fe3+ prior to HPLC analysis to facilitate comparison. The absorbance profile of Ybt (at peak maximum, 17.8 min) is shown in the inset. (C) LC-MS (positive-ion mode) analysis of the DC3000 Ybt HPLC fraction. Black arrows indicate the major ion intensities (m/z) associated with the iron-bound monomer (m/z, 535.1 [FeM+H]+), dimer (1,068.7), and trimer (1,603.5); gray arrows indicate dominant cleavage products. The structure of Ybt is shown in the upper right corner.

