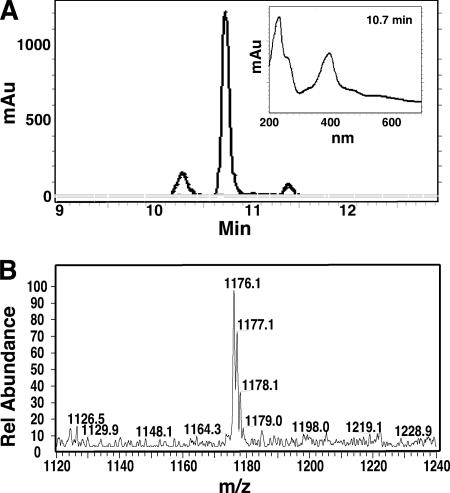
FIG. 6.
Production of Pvd by P. syringae pv. tomato DC3000. (A) HPLC chromatogram showing Pvd peaks, measured by absorbance at 400 nm for culture extracts isolated from iron-limited cultures (black) or high-iron cultures (gray). The absorbance profile of the dominant Pvd peak at its maximum (10.7 min) is shown in the inset. (B) LC-MS (positive-ion mode) analysis of the DC3000 dominant Pvd HPLC fraction. The relative abundance of the major ion intensities (m/z) from 1,120 to 1,240 is shown.

