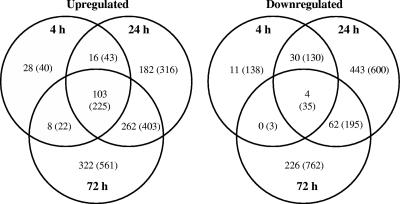
FIG. 2.
Venn diagrams showing statistically significant (α = 0.05) up- and down-regulated genes in the desiccated versus hydrated treatments from B. japonicum microarray analyses. Values shown represent more than 2- and 1.5-fold (in parentheses) differential expression. Identified genes had a global false discovery rate of ≤5%. Six arrays representing a total of 12 replicates of each ORF were analyzed for each of the three desiccation times.

