FIG. 4.
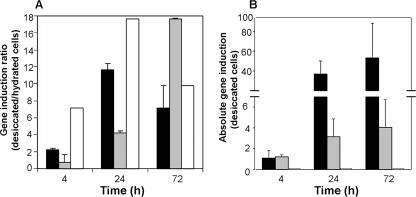
qRT-PCR analysis of differentially expressed trehalose synthesis genes (otsA, treS, treY) in desiccated and hydrated B. japonicum cells normalized to the housekeeping gene parA. (A) Ratio of trehalose synthesis gene expression in desiccated versus hydrated samples. (B) Absolute expression of trehalose synthesis genes (otsA, treS, treY) in desiccated B. japonicum cells (values for treY relative to parA were <0.01; thus, the graph bars are difficult to see). Black bars, otsA; gray bars, treS; white bars, treY. Error bars representing the standard deviation of three biological replicates samples are shown.

