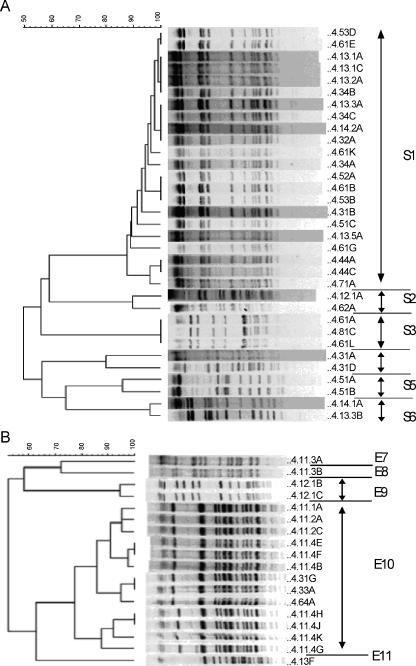
FIG. 1.
Dendrogram (generated using BioNumerics software) of isolates from carrier A based on the unweighted pair-group method with arithmetic averages analysis of PFGE band patterns following digestion with SmaI (A) or EagI (B). Isolate labels are to the right of each band pattern; the first number on the left is the carrier number, followed in numerical order by the month, week, and day the sample was collected; each isolate from the same day was further designated by an uppercase letter. The PFGE genotypes shown are S1 to S6 in panel A and E7 to E11 in panel B.

