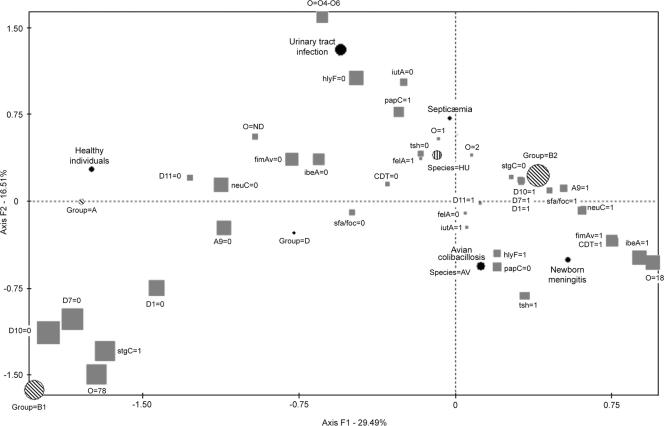
FIG. 2.
Association of VFs with phylogenetic groups in E. coli strains originating from human clinical extraintestinal sources (n = 51), feces of healthy humans (n = 4), or avian colibacillosis (n = 39). In this schematic representation of the FCA, the distributions of VFs and major serotypes are represented on a factorial plane defined by the most discriminating axes: F1 and F2. Factorial axis F1 accounts for 29.49% of the variance, and factorial axis F2 accounts for 16.51% of the remaining variance. The strength of the associations is indicated by the distance between the symbols and the sizes of the symbols (the larger the size of the symbol, the stronger the association). The species of the host (avian or human), phylogenetic group (A, B1, B2, or D), clinical origin (avian colibacillosis, neonatal meningitis, septicemia, urinary tract infection, or healthy individual), O serogroup, and VFs are indicated. The presence or absence of a virulence factor is indicated by “1” or “0,” respectively.

