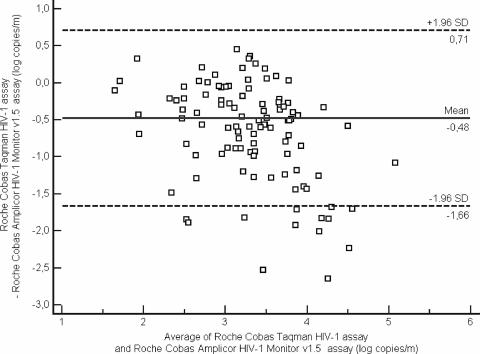
FIG. 1.
Degree of agreement in log10 copies/ml between the COBAS MONITOR 1.5 and the COBAS TaqMan assays for the 160 plasma specimens. The x axis of the Bland and Altman curves bears the mean values for each sample obtained by the two techniques. The y axis bears the differences between the values obtained by the two techniques. The solid lines represent the mean differences between the values, and the dotted lines represent the mean difference plus or minus 1.96 SD (95% limit of agreement).

