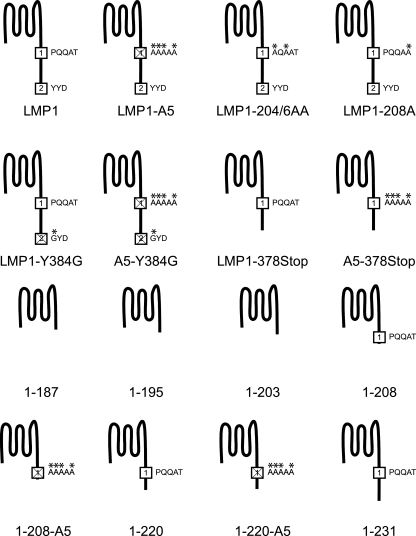
FIG. 2.
Graphical representations of LMP1 mutants. All constructs are tagged at the amino terminus with HA. CTAR1 and CTAR2 are represented by squares with the number 1 or 2 in the square, respectively. Substitutions to CTAR1 or CTAR2 are highlighted with an asterisk above the mutated residue. The mutants in the bottom two rows are truncation mutants.

